Reports and dashboards
Know where every dollar stands
Collectors see today's work. Managers see promises, delinquent balances and collections. Reports open in the browser as PDF or Excel.
- Dashboards by role
- SQL Server reports
- CSV export
Manager dashboard
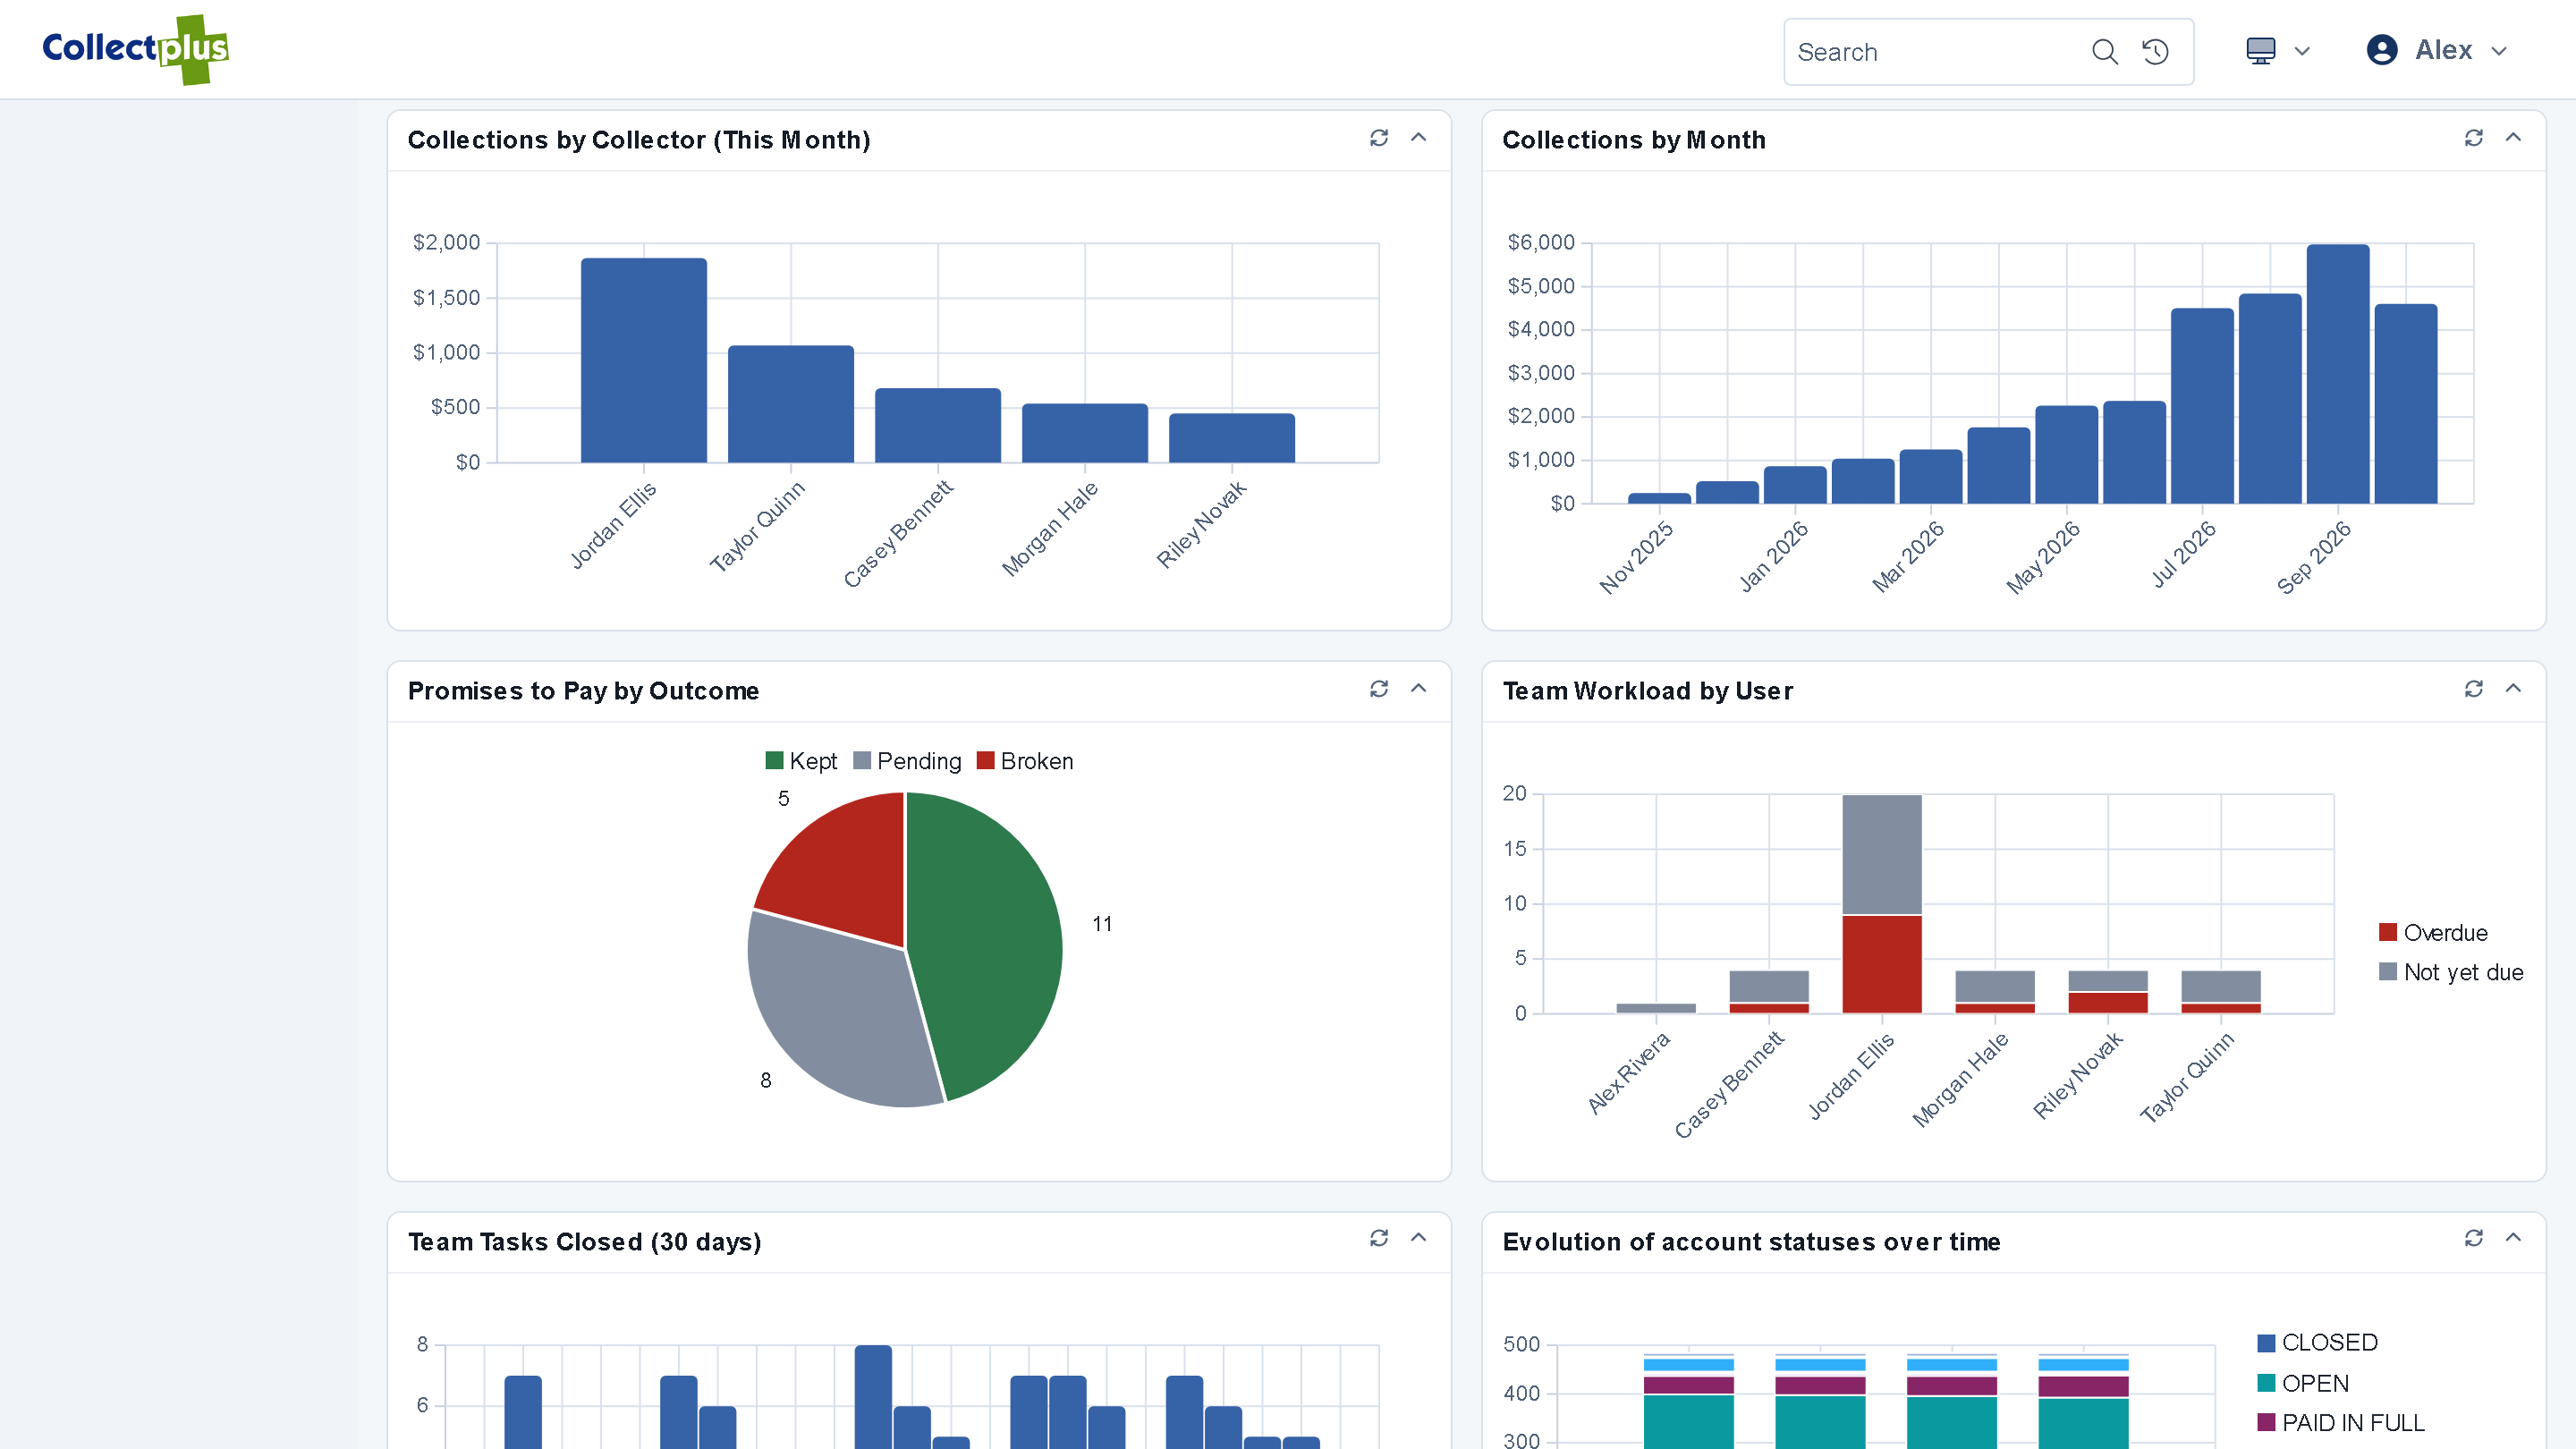
The agency's numbers on one screen
- Promises by outcome. How many promises to pay were kept, and how many were broken.
- Delinquent accounts by status. Where the portfolio stands.
- Delinquent balance by creditor. Which creditor clients hold the most past-due money.
- Collections by date. What came in, day by day.
Collector dashboard
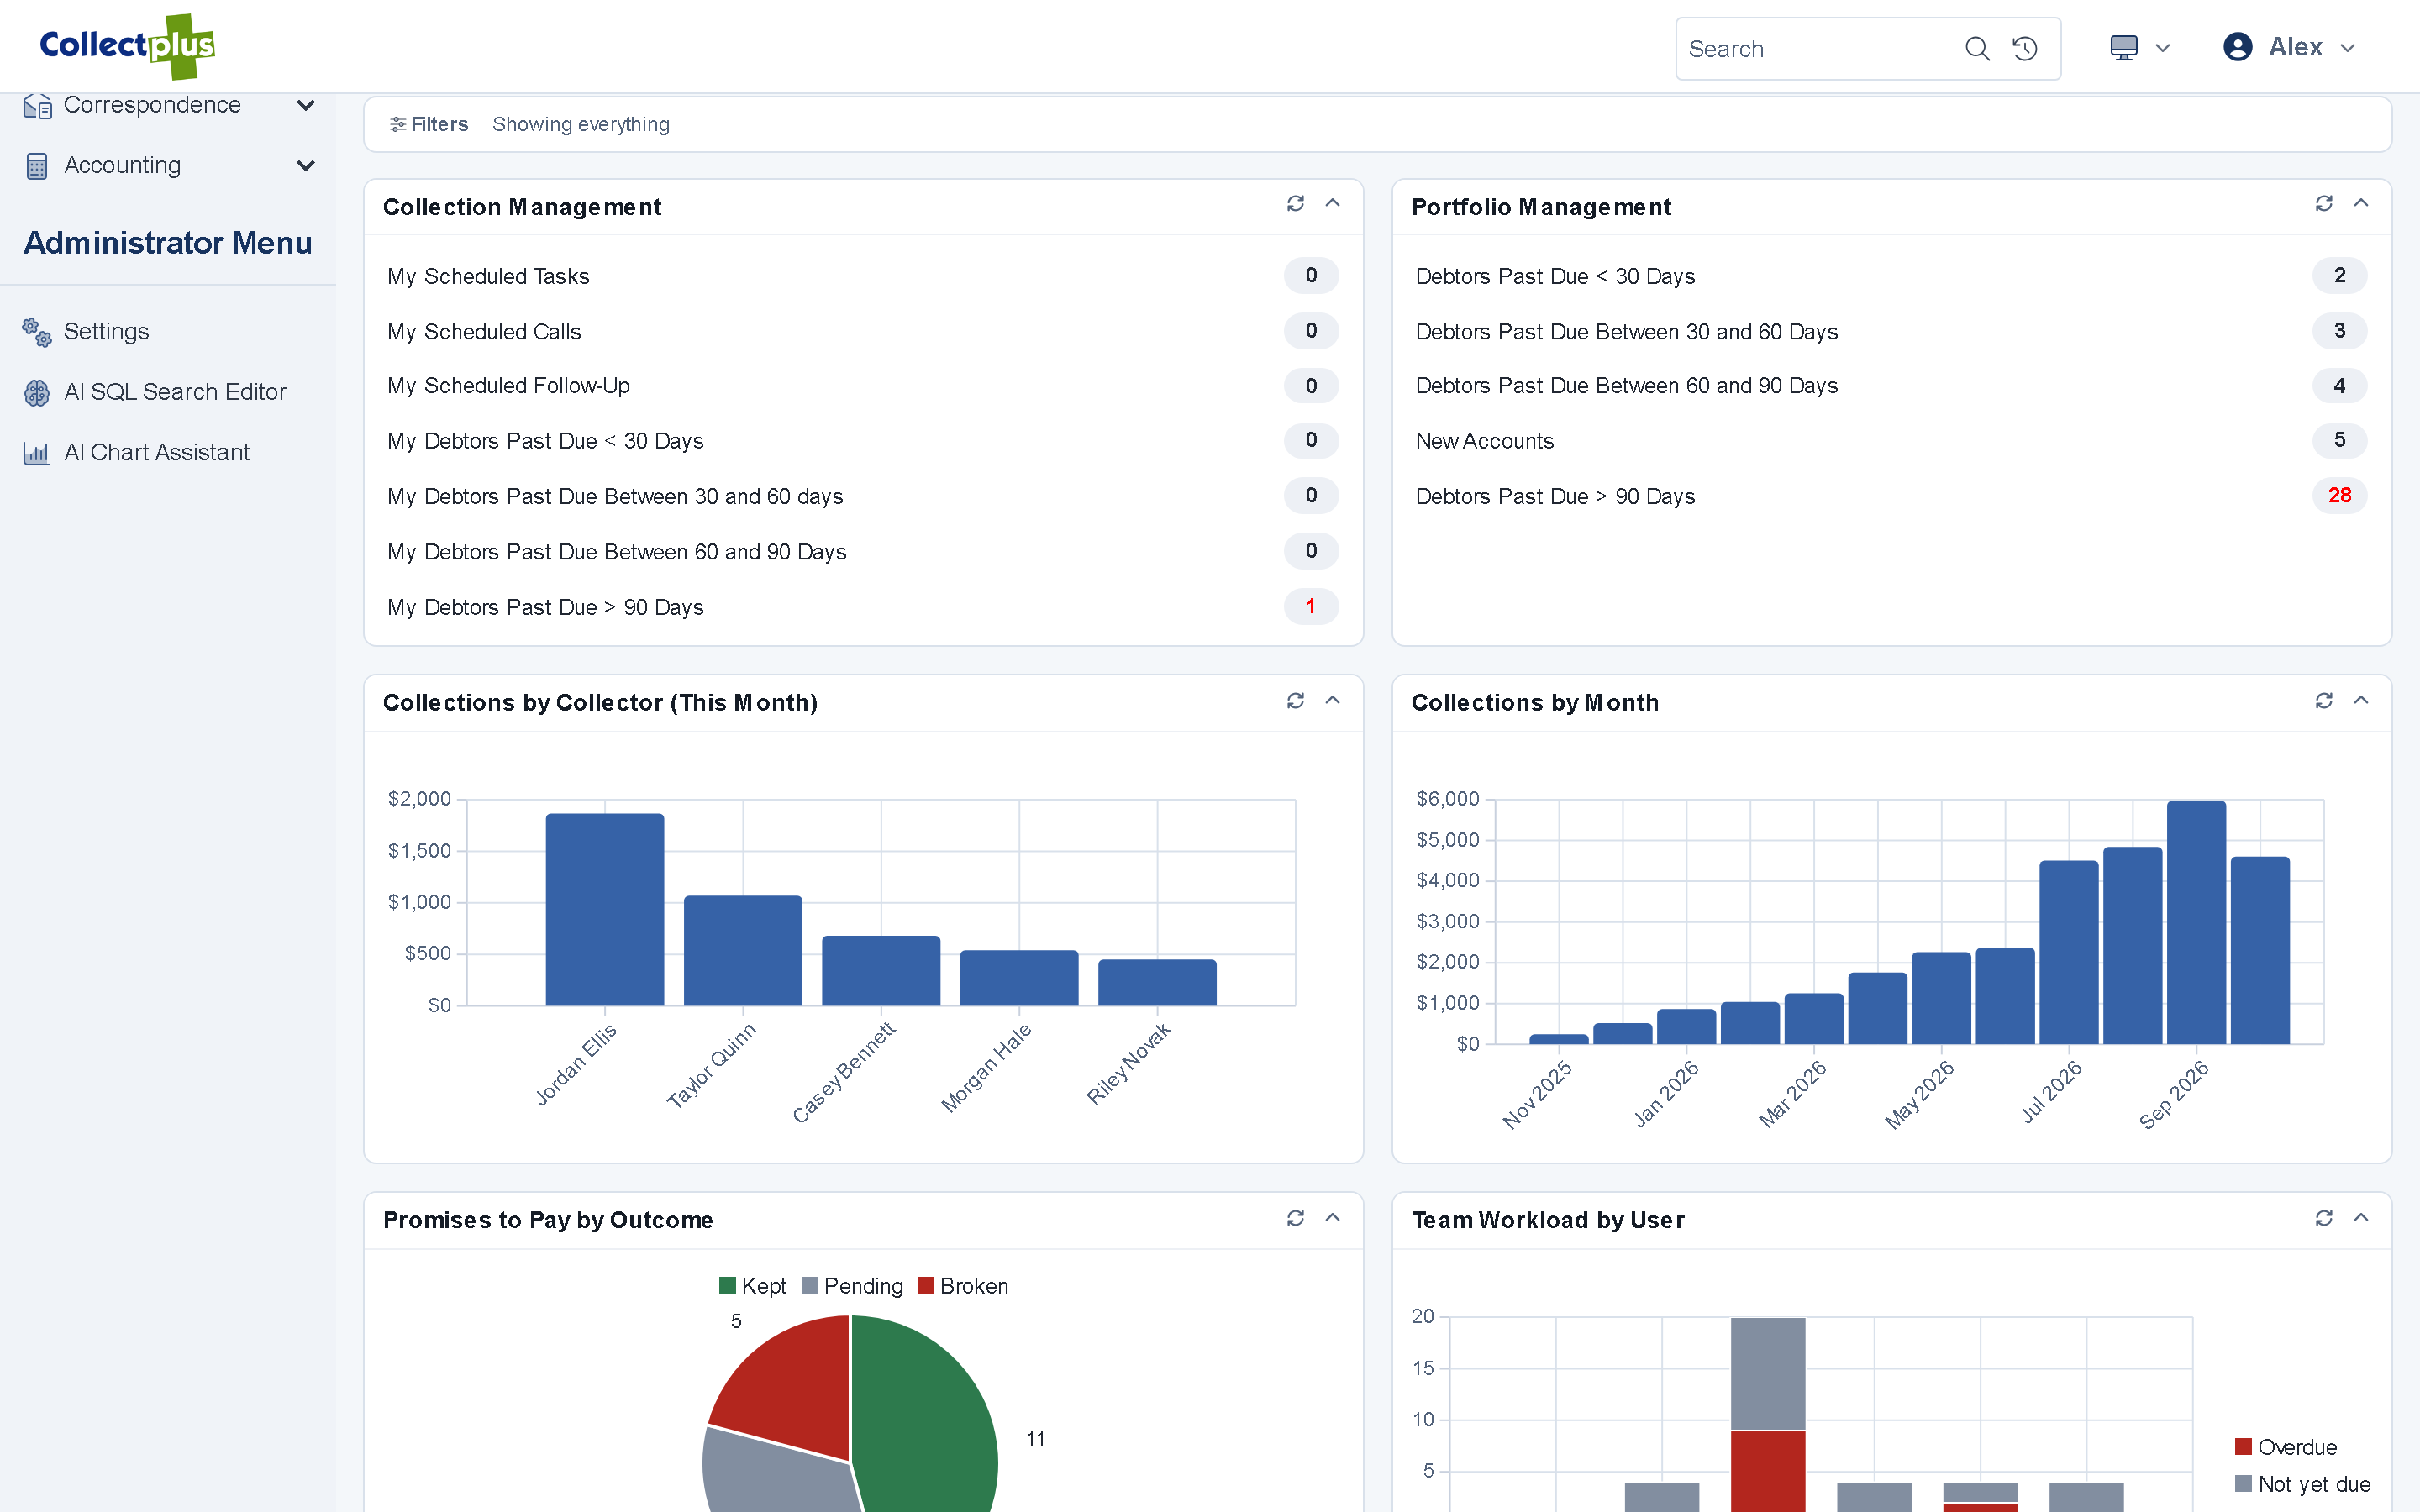
Each collector's day
- Ranked to-dos. Today's tasks in the order they should be done.
- Promises. Open promises to pay, and the ones that were broken.
- Daily briefing. An optional AI summary of what to do first today, and why.
Reports
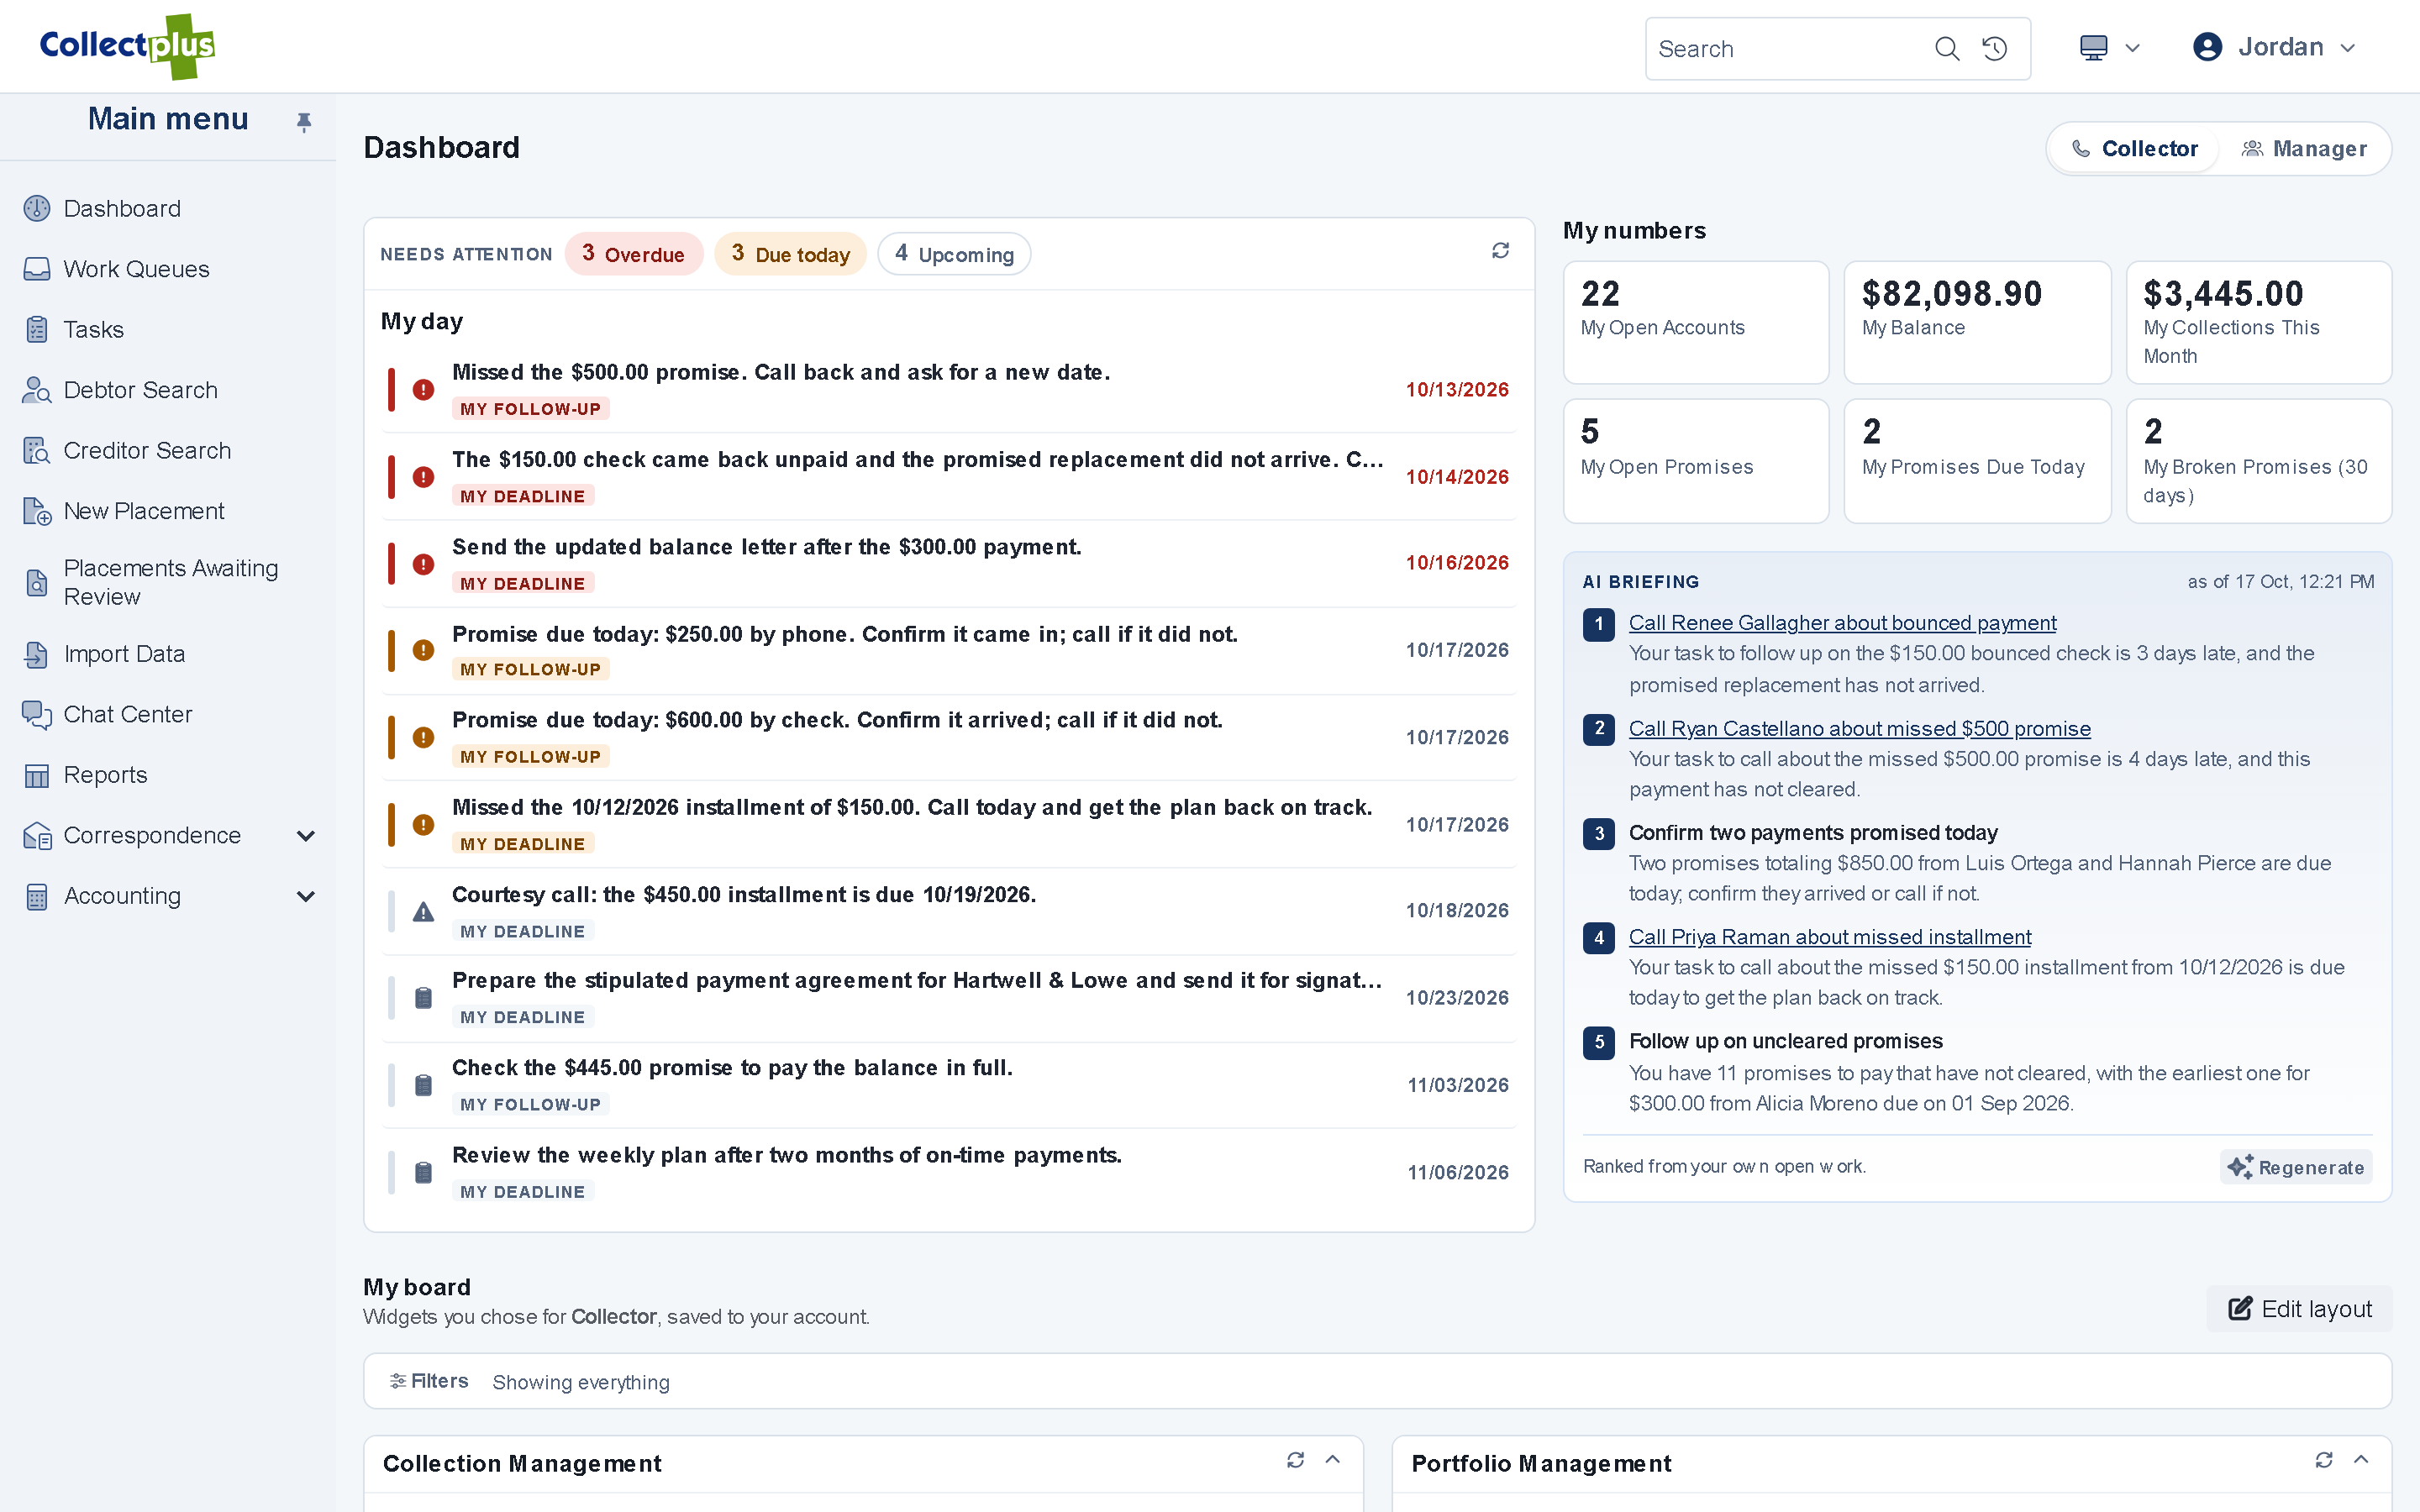
SQL Server reports, in the browser
- PDF or Excel. Open a report in the browser and save it in the format you need.
- Your own reports. Reports are SQL Server Reporting Services reports, so new ones can be added with standard Microsoft tools.
- Every run logged. Each report run is recorded.
Charts and queues
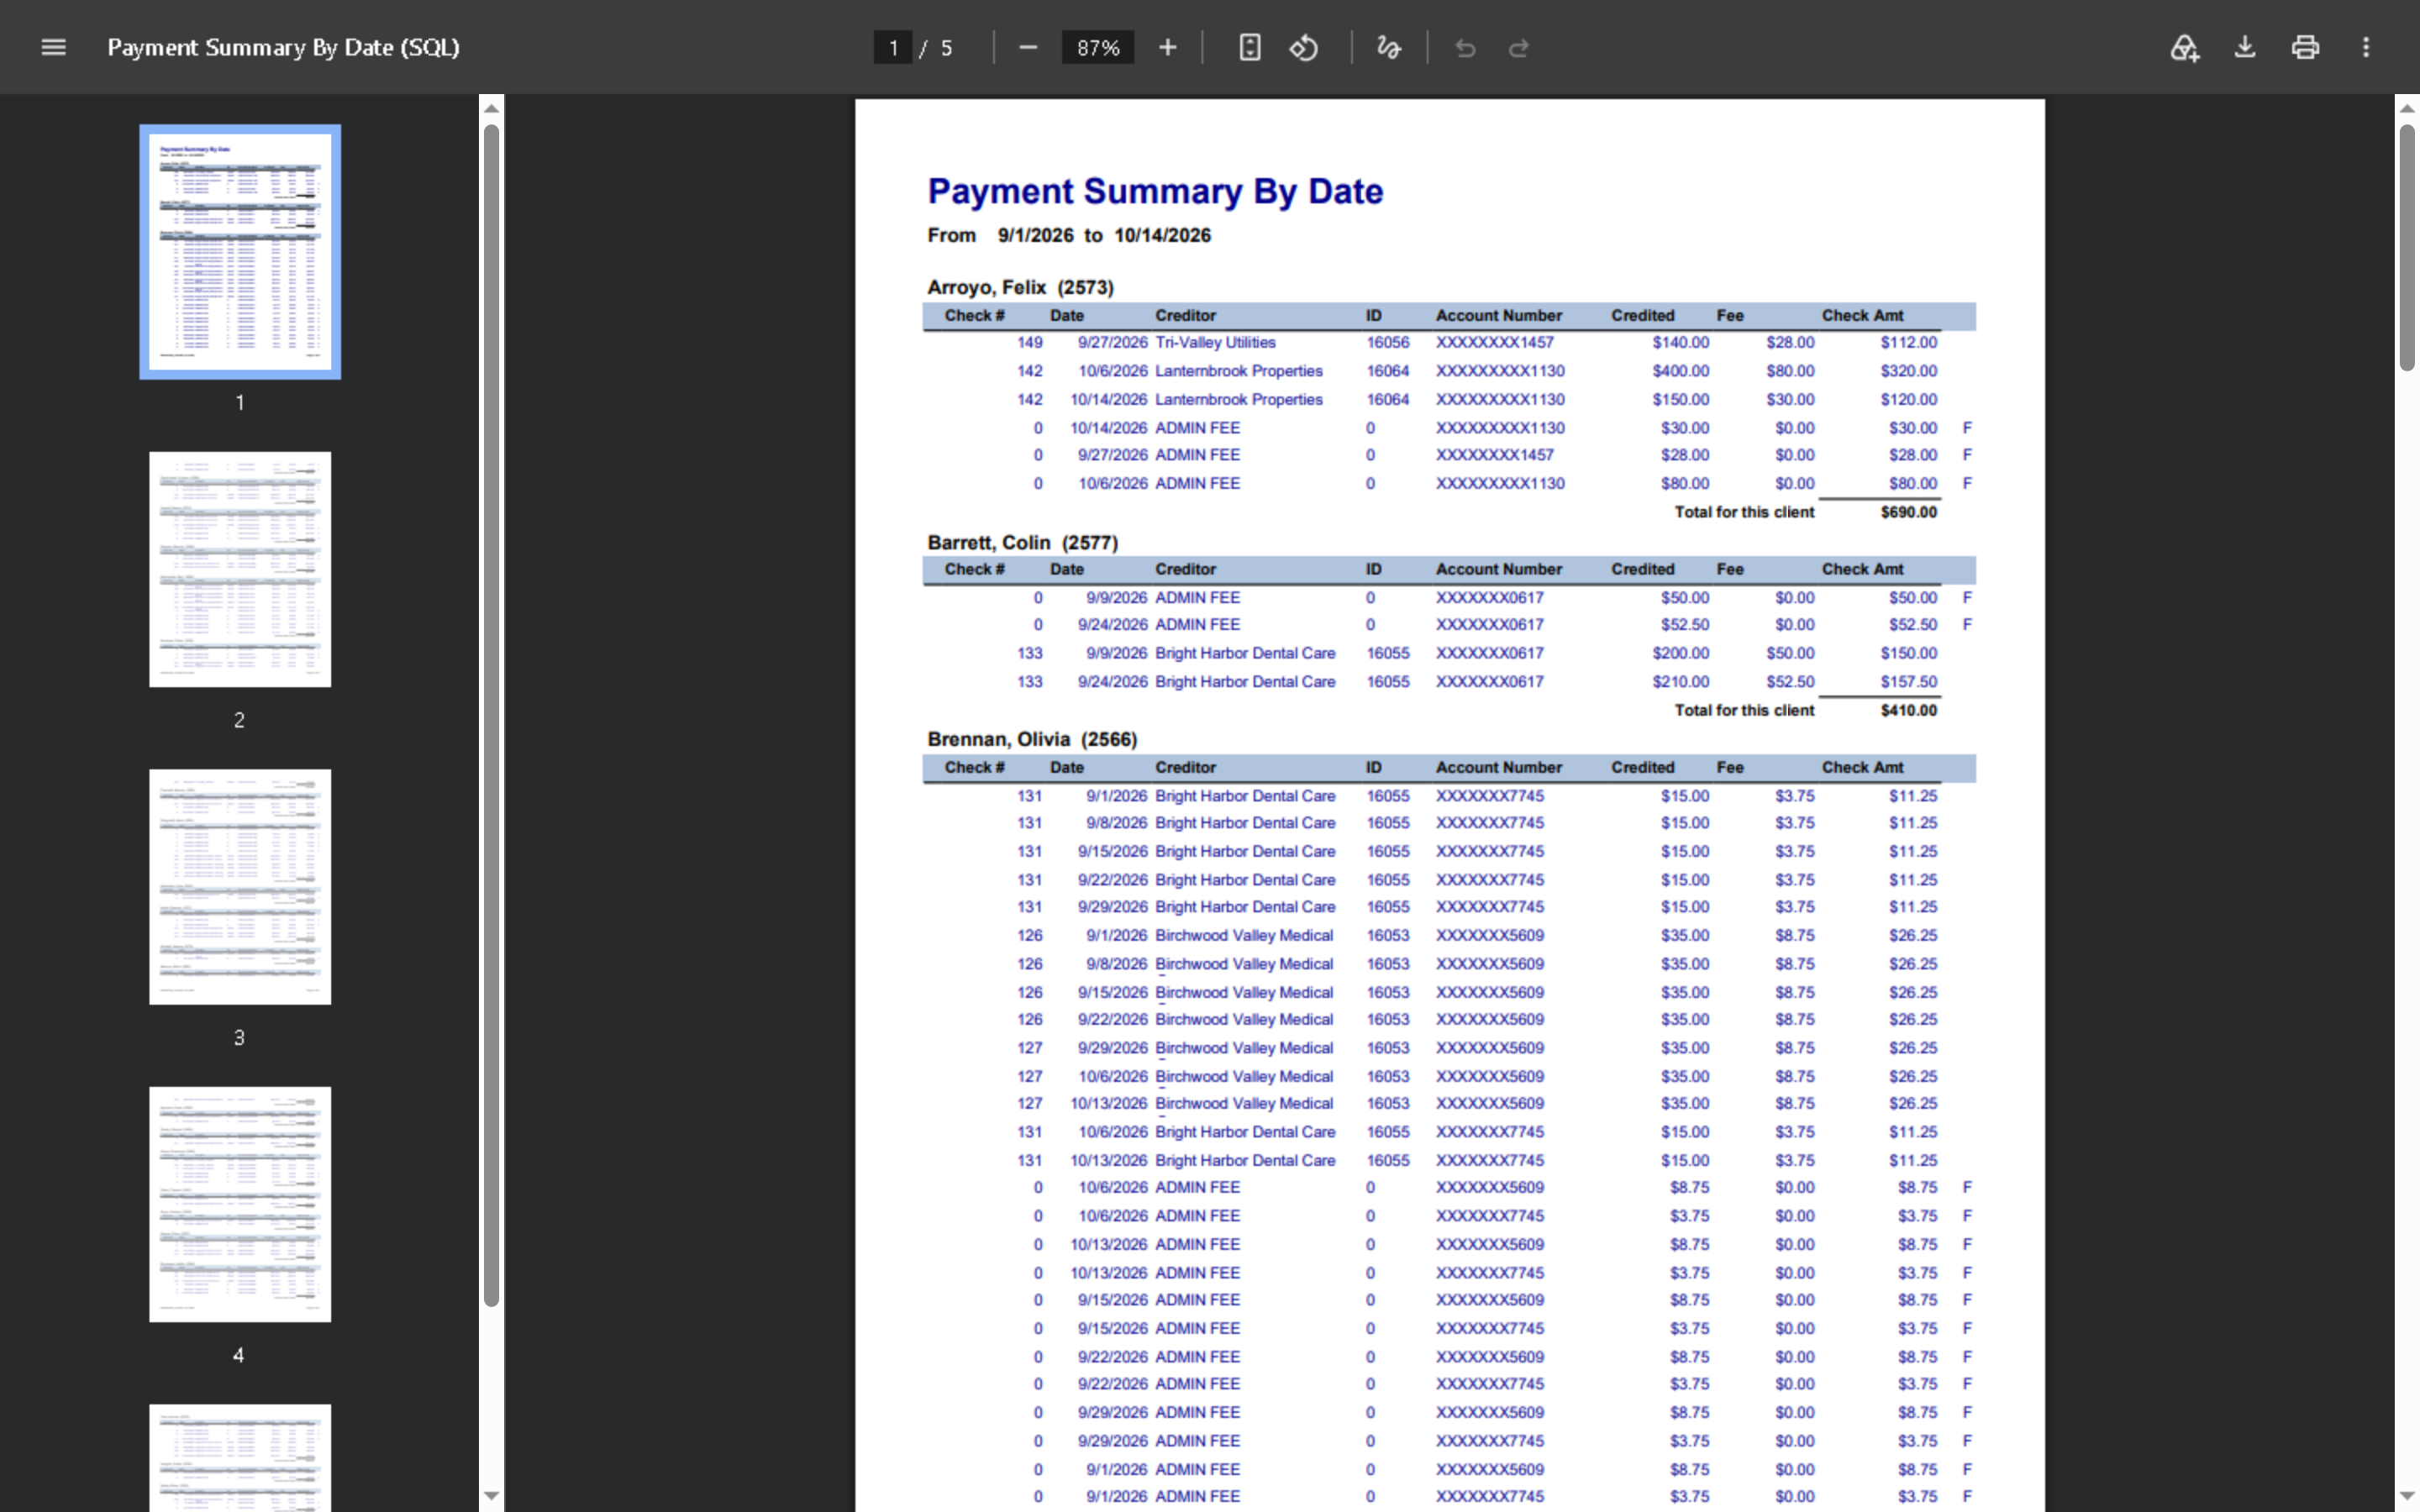
Describe the chart you want
- Chart builder. An administrator describes a chart in plain English, and AI drafts it.
- Queue builder. The same for a work queue: describe the accounts you want to see.
- Reviewed before it is saved. A person checks the result first.
Lists and exports
Any list, out of the system
Work queues as reports
A work queue is a live list built from your rules, so the list a manager wants to see is usually a queue.
Export to CSV
Grids export to CSV, which opens in Excel.
Exports you control
Exporting can be switched off for a kind of login, for example for creditor or debtor logins.
For IT and security teams
How reporting works under the hood
- Reports
- SQL Server Reporting Services reports, rendered in the browser as PDF or Excel. Your team or ours can add reports with the standard Microsoft tools.
- Dashboards
- Charts are defined by your administrators. Chart and queue queries run under a least-privilege database account.
- AI builders
- Administrators describe a chart or a work queue in plain English, and Google Gemini drafts it. Nothing is saved until a person reviews it.
- Export
- Grids export to CSV. Export can be switched off for a kind of login.
- Logging
- Every report run is logged.
FAQ
Reporting questions
Yes. Reports are SQL Server Reporting Services reports, so your team or ours can add new ones with the standard Microsoft tools. Administrators can also describe a chart or a work queue in plain English and let AI draft it.
Yes. Reports open as Excel or PDF, and grids export to CSV, which Excel opens.
Collectors and managers each have their own dashboard. A collector sees today's work and promises; a manager sees promises by outcome, delinquent accounts and balances, and collections by date.
See your numbers on a CollectPlus dashboard
A 30-minute demo covers the reports your creditors and your managers ask for.